
SNOHOMISH COUNTY HOUSING MARKET FORECAST
Home Prices, Market Trends, Graphs Video and Infographics
SNOHOMISH COUNTY HOUSING MARKET AT A GLANCE
Click Image To View Full Size
TABLE OF CONTENTS
3 KEY INDICATORS
Snohomish County Housing Market
- SALES ACTIVITY INTENSITY:
- 64.9% (SURGE)
- INTEREST RATE:
- 6.71% (MANAGEABLE)
- INVENTORY LEVEL:
- 1 Months (SHORTAGE)
THE BIG DEAL
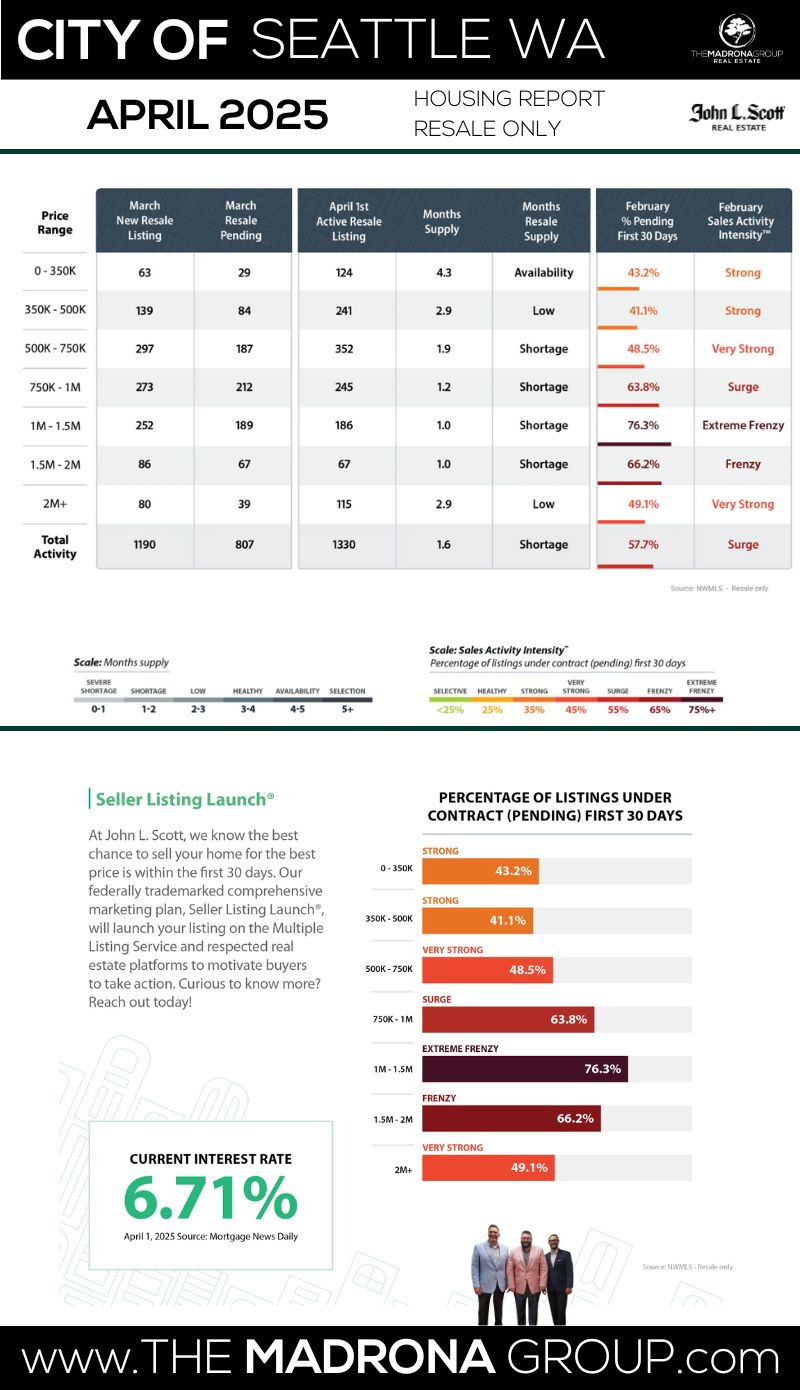
Despite economic uncertainty and higher borrowing costs, Snohomish County’s housing market isn’t slowing down — it’s speeding up. With 64.8% of homes going pending in the first 30 days and just 1.0 month of inventory, we’ve hit Frenzy status. Mortgage rates are holding at 6.71%, and buyers are jumping in fast while competition and prices heat up. If you’re thinking about buying or selling this spring — now’s the time to make your move.Snohomish County Housing Market Report – April 2025: Buyer Demand Ignites as Spring Frenzy Unfolds
With inventory scarce and buyers charging back into the market, Snohomish County is heating up fast this spring. Sellers hold the advantage, but motivated buyers are making bold moves to stay in the game.
The market is revving up as we roll into April 2025. Inventory remains tight at just 1.0 month, keeping Snohomish County firmly in seller’s market territory. Buyer activity is up across the board, and homes are flying off the market — 64.8% of resale listings went pending in the first 30 days in March, a jump that officially puts the county in Frenzy Mode.
The average sale price has climbed to $802,168, with homes selling in just 29 days on average. Even with 1,263 new listings in March, demand outpaced supply as 1,011 homes went pending — a clear sign that buyers are done waiting.
Mortgage rates are holding steady at 6.71%, giving buyers a little more breathing room — but make no mistake, competition is heating up and move-in-ready homes are the hot ticket.
Let’s dive into the three key market drivers and what they mean for buyers, sellers, and everyone watching the Snohomish County market unfold.
Detailed Explanation of the 3 Key Indicators
-
Sales Activity Intensity:
- Definition: This metric reflects the percentage of homes that go under contract within the first 30 days of listing. It's a direct indicator of the market's temperature, showing how quickly homes are moving from listing to pending status.
- Scale:
-
-
-
- <25%: Buyer's market – low demand, homes take longer to sell.
- 25%: Healthy market – balanced demand and supply.
- 35%: Strong market – increasing demand, sellers have a slight advantage.
- 45%: Very strong market – high demand, multiple offers are common.
- 55%: Surge – very high demand, significantly more buyers than available homes.
- 65%: Frenzy – extreme demand, homes sell extremely quickly, often well above asking price.
- 75%+: Extreme frenzy – unprecedented demand, highly competitive conditions.
-
Monthly Inventory Levels:
- Definition: This measures the number of months it would take to sell all current listings at the current sales pace without any new listings being added. It's a critical indicator of market balance.
- Scale:
- 0-1 month: Severe shortage – extremely low inventory, seller's market.
- 1-2 months: Shortage – low inventory, strong seller's advantage.
- 2-3 months: Low – less inventory, leaning towards sellers.
- 3-4 months: Healthy – balanced between buyers and sellers.
- 4-5 months: Selectability – more options for buyers, slight buyer's advantage.
- 5+ months: Buyer's market – high inventory, buyers have leverage.
-
Interest Rates:
- Definition: This refers to the average mortgage rate available to homebuyers. Interest rates are a significant factor affecting affordability and buyer demand.
- Scale (not a fixed scale but commonly accepted ranges):
- 3-4%: Excellent – very favorable for buyers.
- 5-6%: Good – relatively affordable for most buyers.
- 7-8%: Uncomfortable – can slow down buyer activity as financing becomes more expensive.
- 9-10%: Challenging – high rates can lead to decreased demand and slower market activity.
Sales Activity Intensity:
- Definition: This metric reflects the percentage of homes that go under contract within the first 30 days of listing. It's a direct indicator of the market's temperature, showing how quickly homes are moving from listing to pending status.
- Scale:
-
-
- <25%: Buyer's market – low demand, homes take longer to sell.
- 25%: Healthy market – balanced demand and supply.
- 35%: Strong market – increasing demand, sellers have a slight advantage.
- 45%: Very strong market – high demand, multiple offers are common.
- 55%: Surge – very high demand, significantly more buyers than available homes.
- 65%: Frenzy – extreme demand, homes sell extremely quickly, often well above asking price.
- 75%+: Extreme frenzy – unprecedented demand, highly competitive conditions.
-
Monthly Inventory Levels:
- Definition: This measures the number of months it would take to sell all current listings at the current sales pace without any new listings being added. It's a critical indicator of market balance.
- Scale:
- 0-1 month: Severe shortage – extremely low inventory, seller's market.
- 1-2 months: Shortage – low inventory, strong seller's advantage.
- 2-3 months: Low – less inventory, leaning towards sellers.
- 3-4 months: Healthy – balanced between buyers and sellers.
- 4-5 months: Selectability – more options for buyers, slight buyer's advantage.
- 5+ months: Buyer's market – high inventory, buyers have leverage.
Interest Rates:
- Definition: This refers to the average mortgage rate available to homebuyers. Interest rates are a significant factor affecting affordability and buyer demand.
- Scale (not a fixed scale but commonly accepted ranges):
- 3-4%: Excellent – very favorable for buyers.
- 5-6%: Good – relatively affordable for most buyers.
- 7-8%: Uncomfortable – can slow down buyer activity as financing becomes more expensive.
- 9-10%: Challenging – high rates can lead to decreased demand and slower market activity.
Each of these indicators plays a crucial role in interpreting the dynamics of the Seattle housing market. By analyzing trends within these metrics, we can better understand the forces at play, predict future movements, and strategize accordingly. Whether you're looking to buy a home, sell one, or simply keep an eye on market developments, these indicators provide the insights needed to navigate the complexities of Seattle's real estate landscape.
Sales Activity Intensity™
Current Effect:
Snohomish County’s Sales Activity Intensity™ jumped to 64.8% in March, up from 59.5% in February — pushing the market deeper into “Frenzy” territory. That means nearly two-thirds of homes are going pending within 30 days, a bold sign of rising buyer urgency despite affordability pressures.
-
🕒 Average Days on Market: 29 (down from 41)
-
👀 Showings to Pending: Just 7 (a sharp drop from winter’s 16)
-
🎯 Hot Zone: $500K–$800K price range, where competition is especially fierce
What This Means:
📌 For Buyers:
You’re in a fast-moving market. Pre-approval is your entry ticket, and strong, clean offers (with flexible terms or appraisal gap coverage) can make the difference.
📌 For Sellers:
You’re in control — for now. Homes priced right and presented well are flying off the market, often with multiple offers. Listing early this spring gives you an edge before inventory swells.
Monthly Inventory Levels
Current Effect:
Inventory in Snohomish nudged up to 1.0 month, but we’re still deep in seller’s market territory (3-4 months = balanced). Homes are selling faster than new listings can keep up.
-
🏡 New Listings: 1,263
-
🔒 Pending Sales: 1,011
-
✅ Closed Sales: 758
What This Means:
📌 For Buyers:
Choices are improving slightly, but competition isn’t letting up — especially under $800K. Be ready to act fast and lean on your broker for off-market or pre-listing insights.
📌 For Sellers:
Low inventory = more eyes on your home. List now for high visibility and less competition from the late-spring flood of new listings.
Interest Rates
Current Effect:
March’s average 30-year fixed mortgage rate sat at 6.71%, down from February’s 7.05%. It’s still in the “uncomfortable” range, but even this small shift is reigniting buyer interest.
What This Means:
📌 For Buyers:
Don’t let rates freeze you. Explore buydowns, ARM options, and seller concessions — and consider acting before prices rise further.
📌 For Sellers:
Offering rate incentives or closing cost assistance can be a powerful tool to draw in rate-sensitive buyers, especially in higher price points.
Overall Market Trends
Snohomish County is firmly in low-inventory, high-demand mode. Homes are selling at 99.5% of list price — nearly full asking — with the most action in the $500K–$800K range. Luxury properties ($1.5M+) are moving more slowly but still attract steady interest when they deliver on quality and lifestyle.
Key Takeaways
For Sellers:
✔ Nail your pricing and presentation — buyers are savvy.
✔ Listing now maximizes exposure before the inventory wave hits.
For Buyers:
✔ Pre-approval is your superpower.
✔ Be ready to negotiate creatively — smart terms can win deals.
Residential Resale, Condos & New Construction
Residential Resale:
-
🏠 Avg. Price: $802,168
-
⏱ Days on Market: 29
-
💰 List-to-Sale Ratio: 100.2%
Condos:
-
💼 Great entry point for first-time buyers
-
💸 Price/SqFt: $410
-
⚠️ Watch out for HOA fees — they matter in affordability
New Construction:
-
🧱 Avg. Price: $940,043
-
📦 Inventory: 1.8 months (slightly more buyer breathing room)
-
⏱ Days on Market: 38
-
💰 List-to-Sale Ratio: 99.8%
-
📏 Price/SqFt: $417
-
🔥 Showings to Pending: 5
Trends in New Construction:
📌 Builder incentives (rate buydowns, upgrades, closing credits)
📌 Buyers want turnkey, energy-efficient, modern designs
📌 Flex spaces like home offices & gyms still in demand
The Rent vs. Buy Conversation
-
🏡 Avg. 3-Bedroom Rent: $3,100/month
-
📊 Monthly Mortgage on $500K Home @ 6.71% (20% down): ~$3,100/month
Key Takeaway:
If you’re planning to stay 3–5 years or more, buying still wins. Fixed payments, equity growth, and tax advantages make homeownership the clear long-game strategy — even in today’s rate environment.
The Fed’s Influence
The Fed’s staying cautious — no big rate drops expected before late 2025. That means today’s rates are likely as good as it gets for a while.
📌 Buyers: Don’t wait for miracles. Rising prices can offset any future rate savings.
📌 Sellers: Use rate buydowns to attract a wider pool of buyers without cutting your price.
Seasonality
We’re now entering the early Spring Surge Phase — when listings rise, buyer traffic explodes, and competition goes full tilt.
📌 For Sellers:
Get ahead of the pack. Listing now = less competition, more visibility.
📌 For Buyers:
Yes, more listings are coming — but so are more offers. Shopping now can give you more room to negotiate and move fast.
It’s Spring, The Market is Moving!In March, the market began anticipating the full momentum of spring’s increased Sales Activity Intensity™, with both sellers and buyers actively preparing. In the past 31 days, we have seen a trend of more listings and more homes going under contract compared to this time last year. Buyers are experiencing better availability and a decrease in interest rates. J Lennox Scott
LENNOX SCOTT
CEO of John L. Scott Real Estate

Snohomish County Real Estate GRAPHS & Data


In Snohomish County, 64.8% of homes sold in March went pending within the first 30 days — nearly double the benchmark for a balanced market and a loud signal that we’re deep in Surge-to-Frenzy territory.
The most competitive slice of the market? Homes priced between $500K and $750K, where a staggering 69.5% of listings are going pending in the first month. This price point continues to dominate, especially among first-time buyers and move-up buyers who are laser-focused on affordability and value.
Even luxury homes over $1.5M are seeing strong buyer interest — particularly for those that check all the boxes on lifestyle features, smart tech, and location.
Key Takeaways:
📌 For Buyers:
Speed isn’t just smart — it’s essential. In the $500K–$750K range, competition is fierce and timelines are short. Pre-approval, fast decision-making, and flexible offer terms can give you the edge in multiple-offer scenarios.
📌 For Sellers:
If your home is clean, modern, and priced to reflect today’s market — expect activity fast. But don’t let this pace tempt you into overpricing. Today’s buyers are sharp, and even in a hot market, homes that miss the mark can still linger.
📌 For Everyone:
The days-on-market clock is ticking faster than ever. If you want to win — whether buying or selling — timing, strategy, and preparation matter more than ever.
PRICE
-
Current Effect:
The average sale price for homes in Snohomish County rose to $802,168 in March 2025, continuing its steady climb despite affordability headwinds and elevated mortgage rates. Strong buyer demand and low inventory are keeping upward pressure on prices, particularly in the most competitive segments of the market.
By Property Type – March 2025:
-
🏠 Single-Family Homes: $879,833
-
🏢 Condos: $562,078
5-Year Appreciation (March 2020 to March 2025):
-
📈 Overall Home Values: Up 51.4% (from $529,673 to $802,168)
-
🏠 Single-Family Homes: Up 54.9% (from $567,829 to $879,833)
-
🏢 Condos: Up 35.4% (from $414,936 to $562,078)
This isn’t just steady growth — it’s exceptional equity. Over five years, Snohomish County homeowners have seen their investment significantly outpace inflation, further reinforcing the long-term value of homeownership.
Pricing Dynamics
The list-to-sale price ratio currently sits at 99.5%, meaning homes are consistently selling very close to asking price. Even in a higher-rate environment, well-priced homes are commanding solid offers — especially in the $500K–$800K sweet spot where buyer demand is strongest.
Key Takeaways:
📌 For Sellers:
You’ve built serious equity — now could be the ideal time to cash in. The $500K–$800K range continues to attract the most buyers, and well-presented homes (think smart updates and great staging) are moving quickly. Luxury listings are also performing well, especially when they offer premium features and lifestyle appeal.📌 For Buyers:
Yes, rates are higher — but waiting could mean paying more. With home prices steadily climbing and buyer competition heating up, getting in now secures today’s prices and puts you on the path to future appreciation. Snohomish County continues to deliver strong long-term returns, making ownership a smart wealth-building move. -

According to the John L. Scott 6 Phases of the Yearly Housing Cycle, Snohomish County is officially shifting from the New Year Kickoff Phase into the Spring Surge Phase — the busiest and most competitive part of the real estate calendar.
This seasonal shift typically brings:
🌷 A flood of new listings as sellers aim to capitalize on spring buyer demand
🚪 More buyer traffic at open houses as the weather improves and serious shoppers jump into the market
⚔️ Heightened competition — especially in affordable price bands and popular school districts
We’re already seeing this play out: March numbers show pending sales spiking, days on market dropping, and inventory levels still hovering far below balanced conditions. Buyers are coming in strong — and the early-spring sellers are reaping the rewards before April and May bring a rush of new competition.
What This Means:
📌 For Sellers:
Now’s the time to act. Inventory is still tight, and buyer demand is surging. Listing in early spring — especially if your home is move-in ready and well-marketed — can mean faster sales and stronger offers, without as much competition.
📌 For Buyers:
More homes are coming... but so are more buyers. Acting now, while other shoppers are still sorting financing or waiting for "the perfect listing," can give you a leg up. Homes under $1M, particularly in the $500K–$800K range, are already fielding multiple offers — and that pressure will only grow deeper into the Spring Surge.
JOB AND POPULATION GROWTH

WA Employment Security Department
 [Source: U.S. Census Bureau]

Snohomish County Housing Market Stats
STATS PROVIDED BY: INFOSPARK
RESIDENTIAL RESALE
- $802,168 was the average sold price for listings in Snohomish County.
- 1,263 new listings went on the market this month.
- 1,301 homes were for sale during the month.
- 1,011 homes went pending in Snohomish County.
- 758 homes sold this month
- 1 months of inventory available in Snohomish County.
- 29 was the average days on market for a home to sell in Snohomish County.
- 100.2% was the average listing price vs. sales price percentage
- $416 was the average price per square foot in Snohomish County.
- $608,043,123 was the total closed sales volume for Snohomish County.
- 6.71% was the interest rate
- 64.8% of homes sold in the first 30 days in Snohomish County.
- 12 Average showings to go Pending
- 6.4 Showings per Listing
NEW CONTSRUCTION
- $940,043 was the average sold price for new construction in Snohomish County
- 196 new construction listings went on the market this month
- 303 new construction homes were for sale during the month
- 174 new construction homes went pending in Snohomish County
- 175 new construction homes sold this month
- 1.8 months of new construction inventory available in Snohomish County
- 38 was the average days on market for new construction to sell
- 99.8% was the average listing price vs. sales price percentage
- $417 was the average price per square foot in Snohomish County
- $164,507,518 was the total closed sales volume for Snohomish County
- 6.71% was the interest rate
- 5 Average showings to Pending
- 2.3 Showings per Listing

Snohomish County Housing Market Summary
As we close out March 2025, Snohomish County’s housing market remains firmly in seller’s territory, powered by low inventory, rapid sales, and resilient buyer demand — all unfolding against a backdrop of elevated interest rates.
Here’s what the numbers are telling us:
-
✅ 553 homes sold
-
🚀 839 homes went pending — demand continues to outpace supply
-
📦 Inventory sits at just 1.2 months, keeping upward pressure on prices
-
⏱ 41 days average time on market, with 64.8% of homes going pending in the first 30 days
Even with 1,263 new listings, buyers are snapping up inventory at a pace that keeps supply severely constrained. That’s keeping conditions highly competitive — especially in Snohomish’s hottest zones.
Competitive Hot Zones
The $500K–$800K range remains the true battleground for buyers, with a staggering 69.5% of homes in this band going pending within a month. Even luxury listings over $1.5M are drawing more attention — especially those with standout features like energy efficiency, indoor-outdoor living, and premium locations.
Pricing & Strategy
Sellers still hold the advantage — but strategic pricing and stellar presentation are critical. Homes that are priced right, staged well, and move-in ready are commanding strong offers, often at or above asking.
Looking Ahead
As we move further into spring, expect:
-
📈 More listings
-
🧍♂️ More buyers
-
⚔️ More competition
Even with mortgage rates hovering around 6.71%, buyers are showing up in force. Snohomish County’s long-term appreciation trends continue to make it a solid investment, and those who act early in the season may still find strategic opportunities before peak-season pressures fully take over.
Key Takeaway
Whether you're a buyer looking to beat the rush, or a seller ready to capitalize on low competition — the smart move is to act now. In a market moving this fast, timing isn’t just important — it’s everything.
Share this post!


