Seattle “A City of Neighborhoods”
While trying to search for a Seattle neighborhood map the other day I could not find a really good interactive map with boundaries drawn.
So I figured I should make one. I mapped out 78 Seattle Neighborhoods with boundaries. Then added links to all available homes for sale for each neighborhood.
Then I added both a Seattle Real Estate Information and Seattle Housing Market Update link, along with a King County Real Estate Information link.
Play With Our Fully Interactive Seattle Neighborhood Map
View The Map in Full Screen: Seattle Neighborhood Map
HOTTEST NEIGHBORHOODS IN SEATTLE
The Seattle Met Magazin put out an article in June of 2022 by Angela Cabotaje called The Most Coveted Seattle Neighborhoods and Suburbs. Where they rank the Hottest hoods in Seattle. This is the results:
Seattle communities with a real competitive streak.
North Beach and Blue Ridge
Neighborhood: Broadview
Median Sale Price: $1,125,000
Median Sale Price Change YOY: 11%
Average Sale-to-List Ratio: 108.9%
Median Days on Market: 6
Homes Sold Change YOY: 88.9%
It’s not quite country club level, but this southern swath of Broadview sure gets close. Private beaches and parks are a literal thing here—as are the McMansions popping up for Puget Sound views—though the proximity to Golden Gardens and Carkeek Park ensures the public has some semblance of waterfront access too. Good luck finding a sidewalk, a trait typical of North Seattle neighborhoods annexed in or post 1954, but have your pick of preserved midcentury modern homes.
UNLISTED GEM: When the holiday-happy Olympic Manor community gets lit.
Meadowbrook
Neighborhood: Lake City
Median Sale Price: $810,000
Median Sale Price Change YOY: 24.6%
Average Sale-to-List Ratio: 104%
Median Days on Market: 6
Homes Sold Change YOY: 0%
Nature and history converge in this little pocket of Northeast Seattle, where the Duwamish once settled near Thornton Creek before loggers and farmers transformed the area. One remnant, the red-brick LaVilla Dairy milk-processing building, still stands, but nowadays it’s mostly quiet residential areas studded with trees—lots of ’em—ideal for those seeking well-appointed lots within city limits.
Ravenna
Median Sale Price: $1,048,000
Median Sale Price Change YOY: 6%
Average Sale-to-List Ratio: 110.3%
Median Days on Market: 6
Homes Sold Change YOY: 8.1%
The hub that sprang up around a railroad stop is now a confluence of it all: mellow streets, wooded Ravenna Park, a renowned public university, and one “don’t call it a mall” outdoor shopping center. But to really understand its ever-present popularity, just take a look at the array of folks who call this area home—yuppies, college professors, and UW students alike.
UNLISTED GEM: Revitalizing pick-me-ups at Queen Mary Tea Room.
Bryant
Median Sale Price: $1,213,000
Median Sale Price Change YOY: 41%
Average Sale-to-List Ratio: 117.7%
Median Days on Market: 6
Homes Sold Change YOY: -44.4%
Call it the understated cousin of Northeast Seattle. Tucked between more well-known neighborhoods, skinny little Bryant is oft overlooked, but what it lacks in bravado it makes up for with trim houses and tidy tree-lined curbs. Those seeking a touch of hustle and bustle can find it on the south end, where bikers zip by on the curvy Burke-Gilman Trail and businesses line Sand Point Way.
UNLISTED GEM: A business trifecta off NE 45th Street: Great State Burger, Rudy’s Barbershop, Burke-Gilman Brewing Company.
Maple Leaf
Median Sale Price: $750,000
Median Sale Price Change YOY: 10%
Average Sale-to-List Ratio: 109.9%
Median Days on Market: 5
Homes Sold Change YOY: -26.2%
Brokers once nudged first-time homebuyers here, where a mix of new-build condos and modest bungalows offered a gentler parachute into the rabid housing market than more established neighborhoods might. Not anymore. Young families and high-earners both flock to Maple Leaf now for its residential appeal as well as its clusters of commerce along Roosevelt Way.
UNLISTED GEM: Picnic-, pickleball-, and bike-ready Maple Leaf Reservoir Park.
Phinney Ridge
Median Sale Price: $825,000
Median Sale Price Change YOY: -10%
Average Sale-to-List Ratio: 109.7%
Median Days on Market: 6
Homes Sold Change YOY: 50%
Don’t let the seasonal cooling fool you—the median sale price of homes in this enclave topped $1 million during the dog days of last summer. It’s pretty easy to see why. In addition to its sidewalked blocks, knots of freshly erected townhomes, and ample apartment offerings, Phinney Ridge can tout everything from a combo wine shop/bookstore to a Filipino fried chicken spot along Greenwood Avenue and Phinney Way, not to mention the city’s only zoo. If you live on the west side, just be prepared to hoof it—that ridge is no joke.
UNLISTED GEM: Caffeine-saving Home Espresso Repair; look for the spray-painted sign.
Roxhill
Neighborhood: Delridge
Median Sale Price: $701,000
Median Sale Price Change YOY: 8%
Average Sale-to-List Ratio: 109.2%
Median Days on Market: 6
Homes Sold Change YOY: -35%
The landlocked southwest corner of Delridge may be less flashy than other parts of West Seattle—we can’t all fringe Alki Beach, after all—but it still has plenty to appease. Not the least of which is a median sale price hovering in the relative territory of “affordable.” Multiple parks and just-the-basics Westwood Village up the convenience factor considerably, which, after that West Seattle Bridge closure, we know is no small thing.
UNLISTED GEM: Huzzah for ye olde castle-themed play structure (and the skate park too) at Roxhill Park.
Seward Park
Median Sale Price: $725,000
Median Sale Price Change YOY: -34%
Average Sale-to-List Ratio: 106.5%
Median Days on Market: 9
Homes Sold Change YOY: 25%
In 1911, Seattle bought a parcel of land known as Bailey Peninsula for $322,000—about $9.75 million in modern times. Today Seward Park is one of the city’s most beloved retreats, jutting out into Lake Washington like a hook. Naturally, the neighborhood that grew around it draws a number of homeowners seeking not only access to the water but also a medley of homes, from stately structures to retro split-levels to more modest single-story properties.
UNLISTED GEM: Nighttime Owl Prowls through Seward Park led by the Audubon Center.
Victory Heights
Neighborhood: Lake City
Median Sale Price: $860,000
Median Sale Price Change YOY: 41%
Average Sale-to-List Ratio: 111.1%
Median Days on Market: 6
Homes Sold Change YOY: 18.8%
Between shopper-crowded Northgate and car-filled Lake City Way sits Victory Heights. The business-heavy borders of this micro neighborhood make it pretty clear you’re still within city limits, but on sidewalk-less residential blocks, it’s a different story. Towering firs line properties. Lattice fences abound. The price point remains within reach for cramped condo dwellers, though.
UNLISTED GEM: A creative homeowner on 20th Avenue Northeast uses faux skeletons to create a funny-bone-tickling setup.
Wedgwood
Median Sale Price: $1,156,000
Median Sale Price Change YOY: 32%
Average Sale-to-List Ratio: 117.9%
Median Days on Market: 6
Homes Sold Change YOY: -25.8%
Its name? A brand of English china. Its monument? A 19-foot-tall boulder known simply as Wedgwood Rock. Its claim to Seattle fame? The city’s first P-Patch. What sprang up as a planned community during the World War II housing boom has become a repository of local trivia knowledge and also an increasingly popular place for families seeking residential streets with preserved large trees. Matthews Beach and Magnuson Park are also within its vicinity.
UNLISTED GEM: Wedgwood Rock, debris from the Vashon Glacier, is protected from development. Good thing—it weighs 1.5 million pounds.
Whittier Heights
Neighborhood: Ballard
Median Sale Price: $1,042,000
Median Sale Price Change YOY: 15%
Average Sale-to-List Ratio: 110.3%
Median Days on Market: 7
Homes Sold Change YOY: -14.8%
Whittier Heights is a sign of the times, where cranks slap “Free Ballard” bumper stickers on their Subarus to protest the condo developments of recent decades. Its perfectly rectangular grid of streets sports a mix of older but well-kept Craftsmans along with contemporary townhouses and custom single-family homes—with the odd red-brick Tudor for good measure. Interior streets are relatively quiet and pedestrian friendly, while the perimeter is packed with businesses, buses, and other road traffic.
UNLISTED GEM: Quaint brunches at the Fat Hen; the shakshuka is a favorite.
Read Original Article Here: https://www.seattlemet.com/home-and-real-estate/seattle-real-estate-best-neighborhoods-top-suburbs
17 COOLEST NEIGHBORHOODS IN SEATTLE
In 2021 Culture Trip wrote an article about the coolest neighborhoods in Seattle and this is what they thought.
- Columbia City
- Central District
- Georgetown
- Green Lake
- Hillman City
- Ballard
- Belltown
- Capitol Hill
- Chinatown-International District
- Downtown
- Fremont
- Pioneer Square
- Queen Anne
- SoDo
- University District
- Waterfront
- West Seattle
List of 78 Seattle Neighborhoods
This is the list of all the Seattle neighborhood map communities. Each one also has a link to view all homes for sale in that neighborhood.
Seattle Department of Neighborhoods
The city of Seattle has a department dedicated to helping to strengthen their neighborhoods and give the residents a place to learn more about their community and an opportunity to jump in and help.
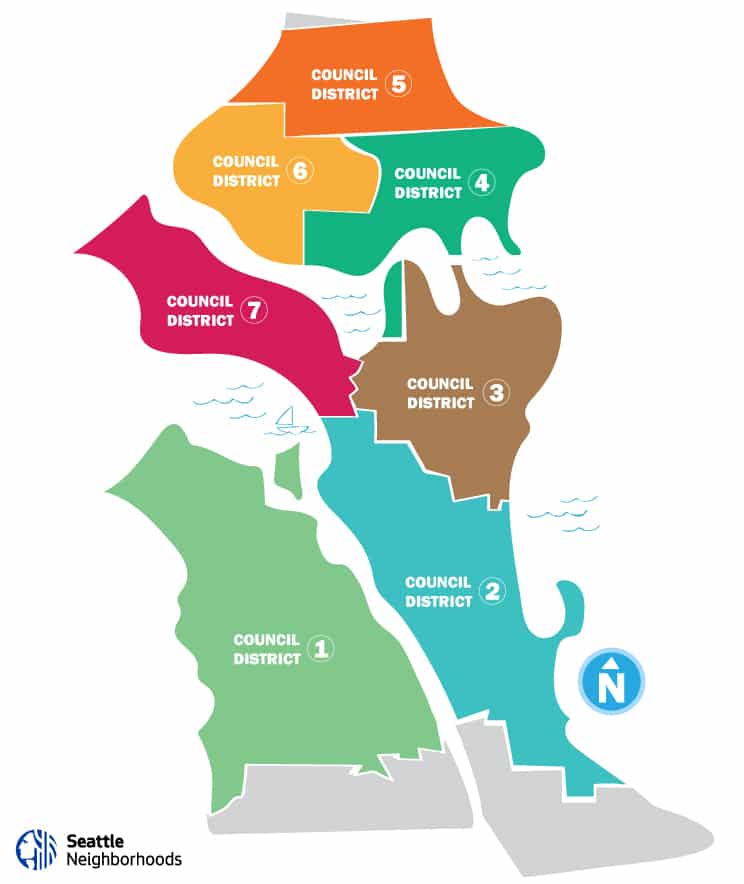
In order to manage this large feat they have divided Seattle into 7 Council Districts. Each one has a Council Member to manage that area and report back to the city.
Below is a Seattle neighborhood map of the 7 different Council Districts:
Are you curious what Council District you fall into: Seattle Neighborhoods and Council District Search Tool
Summary
In a search to find a good Seattle Neighborhood Map I got frustrated and decided to make my own using Google My Maps. You can find it above, and I hope that you find it useful.
Seattle is know as a city of neighborhoods, but it is almost like they are cities in Seattle.
I have mapped out 78 different neighborhoods and have added links to a few resources that we have created on our website including a link to: Seattle homes for sale, Seattle real estate, Seattle housing market and King County real estate.
Share this post!


3 Comments on “78 Seattle Neighborhood Mapped Out on Interactive Map”
This interactive map is amazing! I love how it breaks down each neighborhood in Seattle so clearly. It’s super helpful for planning my next visit. Can’t wait to explore some of these hidden gems! Thanks for sharing!
Thank you.
I love how the interactive map highlights the unique characteristics of each Seattle neighborhood! It’s a great tool for planning my next visit. Can’t wait to explore some of the hidden gems you mentioned!