
SEATTLE HOUSING MARKET FORECAST
Home Prices, Interest Rates, Real Estate Statistics, Video and Charts
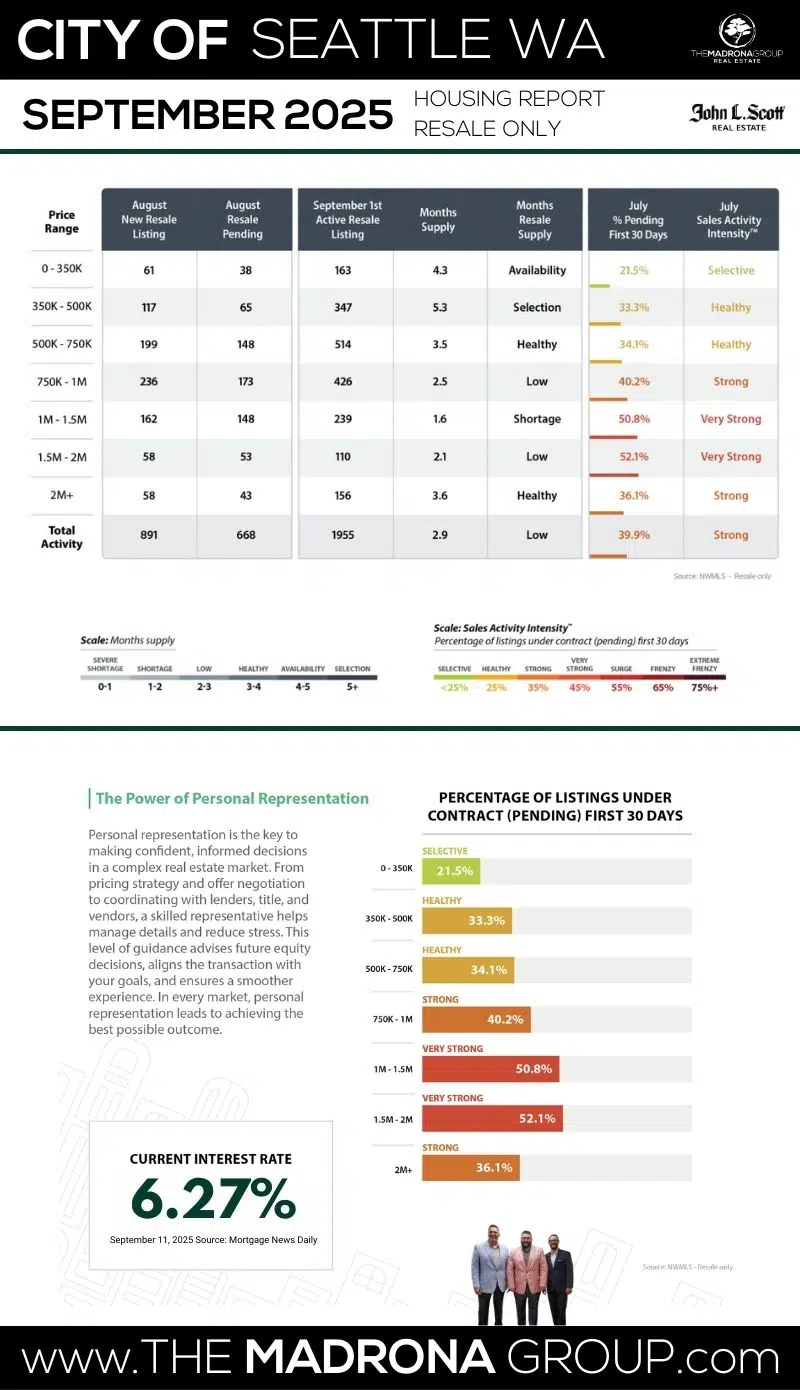
TABLE OF CONTENTS
3 KEY INDICATORS
Seattle Housing Market
- SALES ACTIVITY INTENSITY:
- 39.9% (STRONG)
- INTEREST RATE:
- 6.27% (MANAGEABLE)
- INVENTORY LEVEL:
- 2.9 Months (LOW)
THE BIG DEAL
The star of the show this month is mortgage rates. The 30-year fixed has slid to 6.27% (according to Mortgage News Daily on 9/11/25), the softest it’s been in almost a year. For buyers who’ve been sidelined by affordability math, this is a legit window of opportunity.
Stack that with a 2/1 buydown — which drops first-year payments to about 4.27%, second-year to 5.27%, before settling into today’s rate — and suddenly homes that felt out of reach a few months ago are penciling out.
From Rate Relief to Real Choices Seattle Buyers Catch a Rare Break This Fall
"Mortgage rates dipping to their lowest in nearly a year is the plot twist no one saw coming — and it’s giving buyers back some real leverage."— Jason Fox, The Madrona Group
Seattle, plot twist: the headline this month isn’t bidding wars—it’s interest rates finally taking the elevator down. The 30-year fixed has slipped to ~6.27% as of Sept 11, the lowest in nearly a year and a legit tailwind for fall buyers. Expect more pre-approvals dusted off, a few “we’re back in” texts, and renewed action on well-priced listings.
On the ground, the market has throttled back from spring’s sugar rush but still has horsepower. Sales Activity Intensity clocks in at 39.9%—that’s “Strong,” not sleepy—while inventory has edged to 2.9 months, giving buyers a bit more aisle space without handing them the store keys. (August NWMLS data shows the region broadly flat on price month-over-month, which tracks with what we’re seeing in-city.)
Macro vibes? Tech is still the metronome here. Downtown foot traffic keeps improving post-RTO, yet office vacancies and periodic tech trims make confidence…selective. Translation: lifestyle winners and turnkey homes still get circled fast; fixer fantasies need killer pricing.
Detailed Explanation of the 3 Key Indicators
-
Sales Activity Intensity:
- Definition: This metric reflects the percentage of homes that go under contract within the first 30 days of listing. It's a direct indicator of the market's temperature, showing how quickly homes are moving from listing to pending status.
- Scale:
-
-
-
- <25%: Buyer's market – low demand, homes take longer to sell.
- 25%: Healthy market – balanced demand and supply.
- 35%: Strong market – increasing demand, sellers have a slight advantage.
- 45%: Very strong market – high demand, multiple offers are common.
- 55%: Surge – very high demand, significantly more buyers than available homes.
- 65%: Frenzy – extreme demand, homes sell extremely quickly, often well above asking price.
- 75%+: Extreme frenzy – unprecedented demand, highly competitive conditions.
-
-
-
Monthly Inventory Levels:
- Definition: This measures the number of months it would take to sell all current listings at the current sales pace without any new listings being added. It's a critical indicator of market balance.
- Scale:
- 0-1 month: Severe shortage – extremely low inventory, seller's market.
- 1-2 months: Shortage – low inventory, strong seller's advantage.
- 2-3 months: Low – less inventory, leaning towards sellers.
- 3-4 months: Healthy – balanced between buyers and sellers.
- 4-5 months: Selectability – more options for buyers, slight buyer's advantage.
- 5+ months: Buyer's market – high inventory, buyers have leverage.
-
Interest Rates:
- Definition: This refers to the average mortgage rate available to homebuyers. Interest rates are a significant factor affecting affordability and buyer demand.
- Scale (not a fixed scale but commonly accepted ranges):
- 3-4%: Excellent – very favorable for buyers.
- 5-6%: Good – relatively affordable for most buyers.
- 7-8%: Uncomfortable – can slow down buyer activity as financing becomes more expensive.
- 9-10%: Challenging – high rates can lead to decreased demand and slower market activity.
Each of these indicators plays a crucial role in interpreting the dynamics of the Seattle housing market. By analyzing trends within these metrics, we can better understand the forces at play, predict future movements, and strategize accordingly. Whether you're looking to buy a home, sell one, or simply keep an eye on market developments, these indicators provide the insights needed to navigate the complexities of Seattle's real estate landscape.
Sales Activity Indicator: Strong, Not Spicy 39.9% Go Pending
Seattle’s housing market has eased from its spring sprint, but it’s far from idle. Back in March and April, 75% of new listings were going pending within the first month — the “Extreme Frenzy” zone. Now, we’ve cooled to 39.9%, which still sits firmly in “Strong” territory. That’s a rare three-level drop in market intensity, compared to the typical two-step slowdown from spring to fall.
In September, 1,085 new listings hit the Seattle market, pushing inventory up to 2.9 months — the highest this year. The average time on market stretched to 34 days, and homes are seeing about 12 showings before going pending. Buyers now have more time to decide, but competition for well-priced homes remains alive and well.
Still, don’t get it twisted — homes are closing at 99.4% of list price. This market isn’t sleepy; it’s just trading caffeine for a steadier pace.
📌 What This Means
For Buyers: You’ve got more breathing room, but the best homes still move quickly. Get pre-approved and stay ready.
For Sellers: Well-prepared, competitively priced listings still draw strong offers. Overpricing is a fast track to sitting longer.
Monthly Inventory Levels: More Choices Than Any Time This Year
Seattle’s inventory in September rose to 2.9 months, crossing into the upper end of the “Low” range. That’s up from 2.8 months in August and marks the most selection buyers have had in 2025.
We saw 2,660 active listings this month, giving buyers a better chance to find the right fit. Homes that are staged, priced competitively, and well-marketed are still getting scooped up quickly. Those priced optimistically? They’re hanging around.
📌 What This Means
For Buyers: You’ve got more opportunities to negotiate — especially on listings with longer days on market.
For Sellers: Your competition is growing. Stand out with strong presentation and realistic pricing.
Interest Rates: 6.27% – Manageable and Encouraging
Rates nudged down to 6.27%, the lowest we’ve seen in almost a year. It’s not a dramatic collapse, but in today’s affordability climate, even a modest dip matters. Buyers are leaning into buydown strategies, seller concessions, and creative financing to keep payments within reach.
📌 What This Means
For Buyers: Lock in rates and explore buydown options to make the numbers work.
For Sellers: Offering concessions can keep your price intact while making your home more attractive to buyers.
Overall Market Trends: Cooling, But Still Seller-Friendly
Seattle’s fall market is calmer than spring, but sellers still hold an edge. Inventory is at a yearly high, prices have adjusted seasonally, and market times are a bit longer — yet demand remains steady.
-
Average Resale Price: $1,094,986
-
Average DOM: 34 days
-
Sales-to-List Ratio: 99.4%
📌 Takeaways
For Sellers:
✔ Inventory is at its highest point this year — list sooner to beat fall competition.
✔ Presentation and pricing are critical in this more selective environment.
✔ Concessions can be more effective than price cuts.
For Buyers:
✔ You have more leverage than you did in spring.
✔ Still act quickly on the best-priced homes.
✔ Look to longer-DOM listings for negotiation potential.
Pricing vs. Historical Trends: Long-Term Strength
Despite a seasonal step back, long-term appreciation remains solid. Single-family homes are leading gains, condos are catching up, and new construction continues to command strong values.
Residential Resale
-
Sept 2025 Avg Price: $1,194,459
-
Sept 2020 Avg Price: $948,918
-
5-Year Change: +25.9%
New Construction
-
Sept 2025 Avg Price: $1,026,482
-
Sept 2020 Avg Price: $858,147
-
5-Year Change: +19.6%
Condos
-
Sept 2025 Avg Price: $717,434
-
Sept 2020 Avg Price: $582,406
-
5-Year Change: +23.2%
📌 TL;DR: Seattle home values are holding strong over the long run, even with short-term seasonal fluctuations.
Rent vs Buy – The September Equation
Renting a 3-bed in Seattle still averages around $3,800/month. Buying a $700K home with 20% down at 6.27%? Similar monthly payment — but only one option builds equity.
📌 If you’re staying 3+ years, buying remains the stronger financial move, especially with today’s improved negotiating room.
What About the Fed?
No major policy shifts yet. The Fed remains cautious with inflation, and rates are expected to hover in the 6.25%–6.5% range through the rest of the year. A drop in rates would likely spark increased demand — and potentially more bidding wars.
Fall Seasonality: Slowing Into Autumn
We’re past the seasonal peak. September brings more distractions and slightly slower buyer activity, but serious buyers remain engaged.
📌 Sellers: List now to capture motivated buyers before fall distractions take over.
📌 Buyers: Use this slower pace to shop smart and negotiate.
As we move into FallSeasonal patterns take hold as we see fewer new resale listings being added to the market than over the summer. September typically marks a high point of unsold inventory, offering buyers a brief window of good selection for the next two months. By January, unsold inventory will hit its annual low, with limited new listings expected over the winter until March. J Lennox Scott
LENNOX SCOTT
CEO of John L. Scott Real Estate

Seattle Real Estate GRAPHS AND Data

Seattle’s inventory climbed again in September, now sitting at 2.9 months — up from 2.8 in August and well above the squeeze we felt this spring. That’s a clear tilt toward balance, but let’s be real: we’re still in seller-leaning territory. If no new homes hit the market starting tomorrow, Seattle would burn through its entire housing stock in about 87 days.
Let’s unpack the latest activity:
🏡 1,085 new listings hit the market
🔁 779 homes went pending
✅ 798 homes sold
📦 2,660 homes total on the market
That’s the highest inventory level we’ve seen all year — and it’s giving buyers more breathing room. But in that golden $500K–$1.25M band? Homes are still drawing serious attention. In fact, 39.9% of all listings went pending in the first 30 days. That’s “Strong” territory — a rare three-level slide from the “Extreme Frenzy” of spring, when 75% of listings were snapped up that fast.
💎 Luxury Lane Update
In Seattle’s $2M+ market, things move deliberately — but they do move. Buyers at this level are intentional and selective, favoring turnkey finishes, curated outdoor spaces, and walkable locations. If you’re selling in this range, HGTV-level polish is the minimum standard — not a nice-to-have.
📉 Why Inventory Still Matters
Let’s zoom out:
-
Inventory under 3–4 months = still low supply
-
Low supply + steady demand = continued price pressure
Even with mortgage rates dipping to 6.27%, Seattle buyers aren’t tapping out. They’re adapting — leveraging buydowns, flexible terms, and creative financing to make the math work. This isn’t a panic market; it’s a strategy market.
📌 Key Takeaways
For Buyers:
✔️ You’ve got the widest selection of 2025 — but the best homes still move quickly.
✔️ Be flexible, be prepared, and know where you can gain an edge.
✔️ Want value? Target longer-DOM listings with motivated sellers.
For Sellers:
✔️ Inventory is rising — don’t wait for more competition to pile in.
✔️ Homes under $1.5M are still moving quickly — if priced right.
✔️ In the $2M+ range? Invest in pro staging, landscaping, and next-level listing media.
MARKET INTENSITY
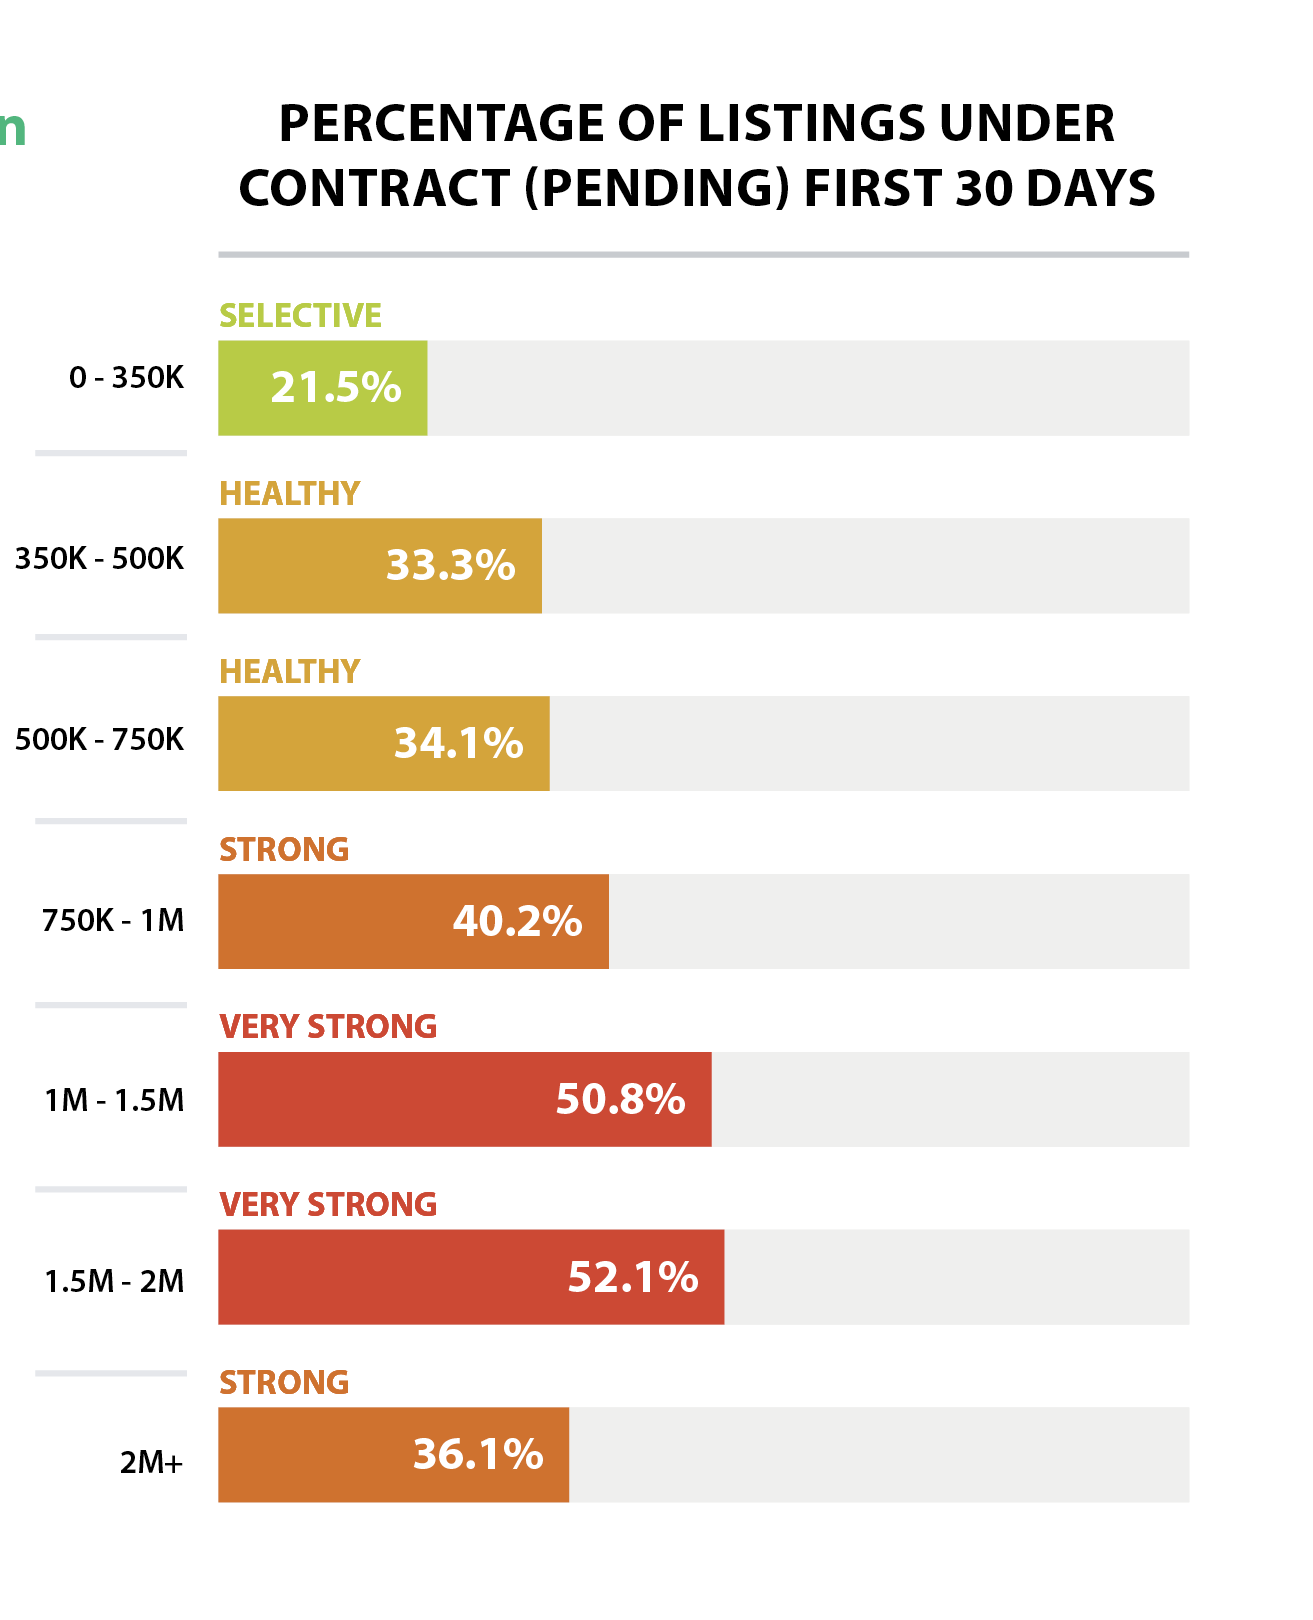
In September 2025, 39.9% of Seattle homes went pending within the first 30 days. That’s a step down from August’s 40.6% and far below the 75% “Extreme Frenzy” pace we saw back in spring — a rare three-level cool-down, moving us from “Extreme Frenzy” → “Surge” → “Very Strong” → “Strong.”
The pace hasn’t collapsed — it’s simply shifted from frantic to focused. Buyers are still very much in the game, but they’re arriving with checklists instead of blindfolds. With more inventory (2.9 months, the highest this year), offers are more thoughtful, but in the $500K–$1.25M sweet spot, competition is still alive and well, with multiple-offer scenarios common for move-in-ready homes.
Even higher-tier properties in the $1.5M–$2M range are moving briskly when they deliver smart layouts, energy efficiencies, and coveted neighborhood appeal. The “list it Friday, sell it Monday” routine is mostly gone, but the right home still finds a buyer within weeks.
📌 Key Takeaways
For Buyers:
✔ Nearly 4 in 10 listings are gone in 30 days — be ready to move fast on well-priced homes.
✔ Pre-approval + clean terms = stronger leverage at the table.
✔ For negotiation power, look just above your budget at homes with longer DOM or price reductions.
For Sellers:
✔ You still have the upper hand — but only if you prep, price, and present strategically.
✔ Buyers are savvy; professional staging, upgrades, and marketing are non-negotiable.
✔ Lifestyle features like EV chargers, outdoor living upgrades, and home offices stand out in this market.
Bottom line? The heat has dialed down, but Seattle’s still a seller-friendly market. Precision and preparation are the difference between “just listed” and “just sold.”
PRICE
Seattle’s average residential resale price in September 2025 came in at $1,094,986 — a seasonal step back from August but still reflective of strong long-term demand. With inventory at its highest level this year (2.9 months) and buyers taking more time, sellers are adjusting strategies — and the data shows it’s paying off.
📊 Price by Property Type:
🏠 Single-Family Homes: $1,194,459
🏢 Condos: $717,434
These figures reflect durable long-term growth, even as monthly fluctuations create temporary softening.
📈 Five-Year Appreciation Snapshot (Since Sept 2020)
-
Overall Market: ⬆️ ~22%
-
Single-Family Homes: ⬆️ 25.9% (from ~$948,918 to $1,194,459)
-
Condos: ⬆️ 23.2% (from ~$582,406 to $717,434)
Even with seasonal dips, the long-term view is clear: Seattle real estate continues to build wealth through multiple market cycles.
💰 Pricing Dynamics
-
List-to-Sale Ratio: 99.4% — homes are still closing just shy of asking price.
-
Condos: More price-sensitive, but the rebound from 2020 is now undeniable.
-
Sweet Spot: $500K–$1.25M homes remain the most competitive.
-
Overpriced/Dated Listings: Sitting longer and trending toward inevitable price cuts.
📌 Key Takeaways
For Sellers:
✔ If you’ve owned 5+ years, you’re likely sitting on significant equity. Price in line with today’s market — buyers know their comps.
✔ The market rewards polished, strategically priced homes. Ambition without accuracy = longer DOM.
For Buyers:
✔ Big price drops aren’t coming — Seattle history says seasonal dips are your opportunity.
✔ Buy now, and let long-term appreciation do its work.
TIMING
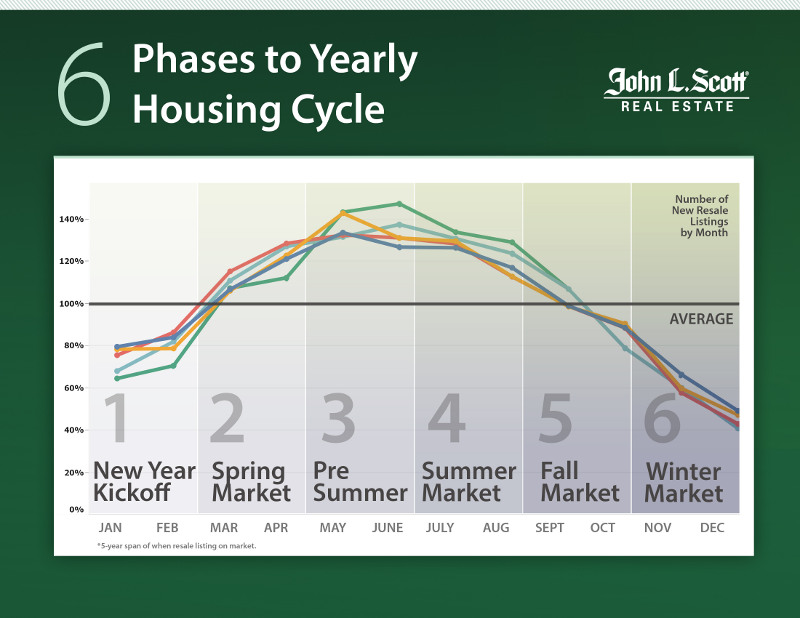
We’ve officially moved past the high-speed phase of Seattle’s housing cycle and into the early-fall slowdown. March and April brought the frenzy, June and July shifted into strategy mode, and August marked the first cooling step. Now September is carrying that trend forward with more listings, more choices, and longer days on market — giving buyers breathing room, but not full control.
Here’s what September looked like in real-time:
🍂 1,085 new listings hit the Seattle market
🔁 779 homes went pending
✅ 798 homes closed
⚔️ Homes under $1.25M? Still the battleground — clean, well-priced homes don’t sit long.
With inventory at 2.9 months — the highest this year — buyer demand hasn’t disappeared; it’s simply become more selective. Urgency is now paired with checklists, financing prep, and strategic offers instead of blind bidding wars.
📌 What This Means
For Sellers:
✔ This is still your moment, but buyers are choosier — prep, price, and present your home to stand out.
✔ Curb appeal, outdoor living spaces, and move-in-ready condition remain top winners.
✔ Consider listing sooner rather than later to beat deeper fall distractions.
For Buyers:
✔ More listings mean more opportunities to find “the one.”
✔ In the under-$1.25M range, speed and preparation are still key.
✔ Pre-approval and strong terms remain your sharpest tools in a competitive pool.
Bottom line? We’re in early-fall mode: slower, steadier, but still active. The buyers left in the game are serious, and the sellers who adapt to this selective season are still walking away with strong offers.
JOB AND POPULATION GROWTH
Washington State Non Farm Employment Numbers
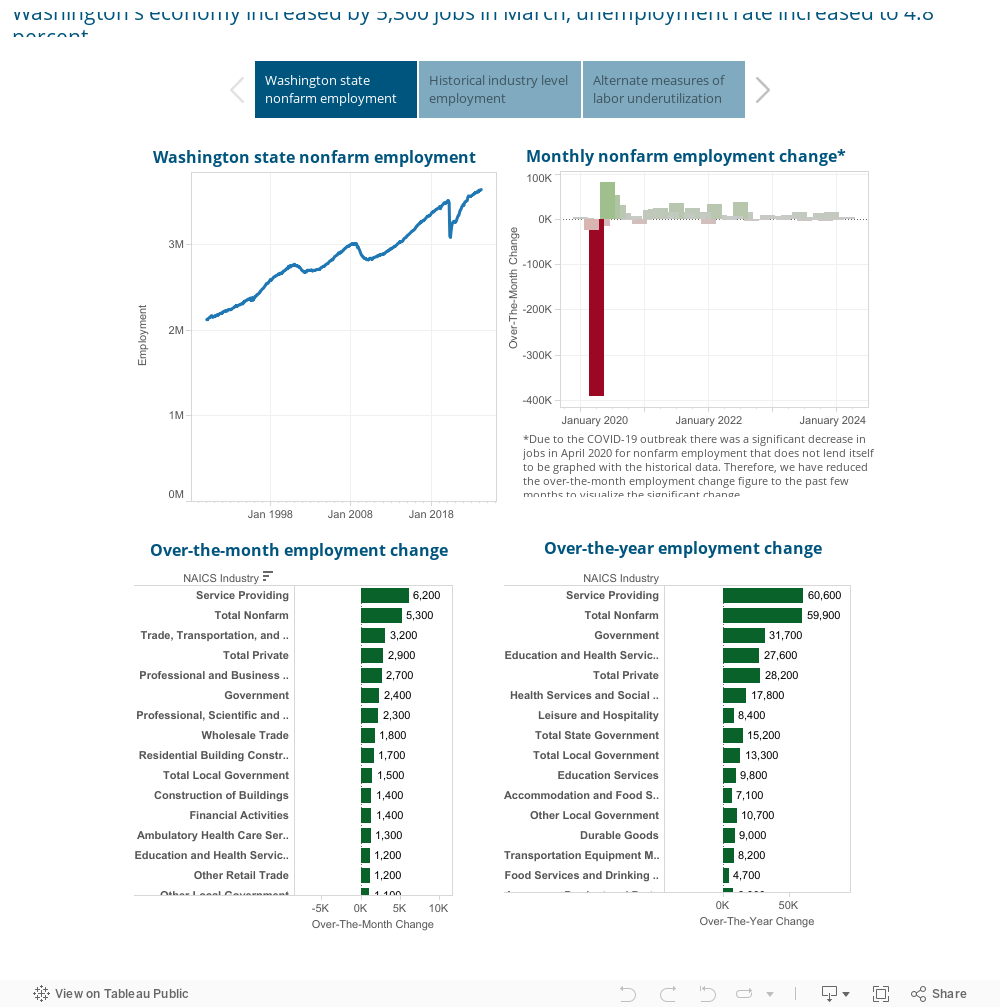
WA Employment Security Department
 [Source: U.S. Census Bureau]

Seattle Market Stats
STATS PROVIDED BY: INFOSPARK
RESIDENTAL RESALE
- $1,094,986 was the average sold price for listings in Seattle.
- 1,085 new listings went on the market this month.
- 2,660 homes were for sale during the month.
- 779 homes went pending in Seattle.
- 798 homes sold this month.
- 2.9 months of inventory available in Seattle.
- 34 was the average days on market for a home to sell in Seattle.
- 99.4% was the average listing price vs. sales price percentage.
- $578 was the average price per square foot in Seattle.
- $870,513,492 was the total closed sales volume for Seattle.
- 6.27% was the interest rate.
- 39.9% of homes sold in the first 30 days in Seattle.
- 12 Average showings to Pending.
- 4.3 Showings per Listing.
NEW CONSTRUCTION
- $949,846 was the average sold price for new construction in Seattle.
- 210 new construction listings went on the market this month.
- 532 new construction homes were for sale during the month.
- 121 new construction homes went pending in Seattle.
- 121 new construction homes sold this month.
- 4.6 months of new construction inventory available in Seattle.
- 35 was the average days on market for a new construction to sell in Seattle.
- 99.5% was the average listing price vs. sales price percentage.
- $653 was the average price per square foot in Seattle.
- $114,931,371 was the total closed sales volume for Seattle.
- 6.27% was the interest rate.
- 9 Average showings to Pending.
- 9 Showings per Listing.
SEATTLE HOUSING MARKET Summary
As we close out September, Seattle’s housing market is still showing a rare three-level cool-down from spring’s frenzy — yet it continues to hold firm in “Strong” territory. Buyers and sellers remain active, but the pace has shifted from sprinting to strategic moves.
🕒 Homes are selling in 34 days on average — slower than August, but still quick compared to historic norms.
💰 List-to-sale price ratio is 99.4% — well-prepped homes are landing near asking.
⚡ Sales Activity Intensity™ landed at 39.9%, down slightly from August’s 40.6% and well below spring’s 75% peak, giving buyers more breathing room.
📦 Inventory climbed to 2.9 months, the highest level of 2025, giving buyers the widest selection this year.
📉 Interest rates dipped to 6.27%, the lowest in nearly a year, boosting affordability and sparking fresh buyer interest.
🔮 Looking Ahead
📌 For Sellers:
You still have the upper hand, but precision is key. Price to today’s market, stage thoughtfully, and list before fall distractions cool buyer activity further. Under $1.5M? Still moving quickly when priced right. Over $2M? Luxe presentation, pro staging, and sharp marketing are mandatory.
📌 For Buyers:
You’ve got more choice and fewer bidding wars than earlier in the year, but the best homes still draw competition. This is a market for prepared buyers — have your pre-approval in hand and your numbers dialed in. If rates dip again, competition will heat back up.
🧭 The Big Picture
The Seattle housing market in September 2025 is strong, just running at a calmer tempo than spring. Inventory is up, rates are softer, and both sides are negotiating with strategy instead of speed. Sellers can still secure strong offers; buyers have more leverage than they’ve had in years.
This isn’t a sit-back-and-wait market. It’s a watch-and-move market.
Whether you’re buying, selling, or just tracking trends, one truth holds: in 2025, preparation wins.
Share this post!